This function plots a whole dashboard with a model's results. It will automatically detect if it's a categorical or regression's model by checking how many different unique values the dependent variable (tag) has.
Usage
mplot_full(
  tag,
  score,
  multis = NA,
  splits = 8,
  thresh = 6,
  subtitle = NA,
  model_name = NA,
  plot = TRUE,
  save = FALSE,
  subdir = NA,
  file_name = "viz_full.png"
)
Arguments
- tag
Vector. Real known label.
- score
Vector. Predicted value or model's result.
- multis
Data.frame. Containing columns with each category probability or score (only used when more than 2 categories coexist).
- splits
Integer. Number of separations to plot
- thresh
Integer. Threshold for selecting binary or regression models: this number is the threshold of unique values we should have in 'tag' (more than: regression; less than: classification)
- subtitle
Character. Subtitle to show in plot
- model_name
Character. Model's name
- plot
Boolean. Plot results? If not, plot grid object returned
- save
Boolean. Save output plot into working directory
- subdir
Character. Sub directory on which you wish to save the plot
- file_name
Character. File name as you wish to save the plot
See also
Other ML Visualization:
mplot_conf(),
mplot_cuts(),
mplot_cuts_error(),
mplot_density(),
mplot_gain(),
mplot_importance(),
mplot_lineal(),
mplot_metrics(),
mplot_response(),
mplot_roc(),
mplot_splits(),
mplot_topcats()
Examples
# \donttest{
Sys.unsetenv("LARES_FONT") # Temporal
data(dfr) # Results for AutoML Predictions
lapply(dfr, head)
#> $class2
#> tag scores
#> 1 TRUE 0.3155498
#> 2 TRUE 0.8747599
#> 3 TRUE 0.8952823
#> 4 FALSE 0.0436517
#> 5 TRUE 0.2196593
#> 6 FALSE 0.2816101
#>
#> $class3
#> tag score n_1 n_2 n_3
#> 1 n_3 n_2 0.20343865 0.60825062 0.18831071
#> 2 n_2 n_3 0.17856154 0.07657769 0.74486071
#> 3 n_1 n_1 0.50516951 0.40168718 0.09314334
#> 4 n_3 n_2 0.30880713 0.39062151 0.30057135
#> 5 n_2 n_3 0.01956827 0.07069011 0.90974158
#> 6 n_2 n_3 0.07830017 0.15408720 0.76761264
#>
#> $regr
#> tag score
#> 1 11.1333 25.93200
#> 2 30.0708 39.91900
#> 3 26.5500 50.72246
#> 4 31.2750 47.81292
#> 5 13.0000 30.12853
#> 6 26.0000 13.24153
#>
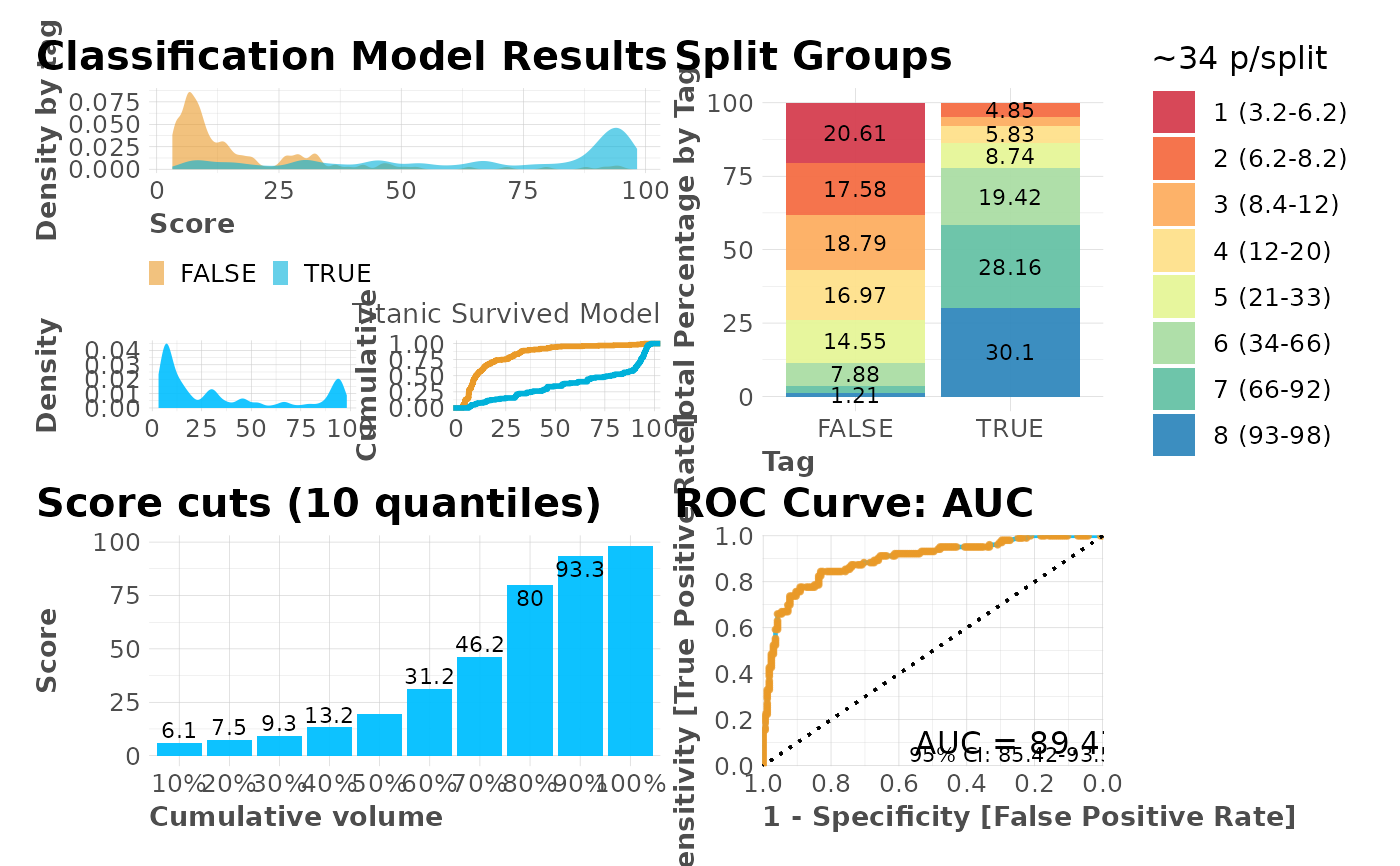
# Dasboard for Binomial Model
mplot_full(dfr$class2$tag, dfr$class2$scores,
model_name = "Titanic Survived Model"
)
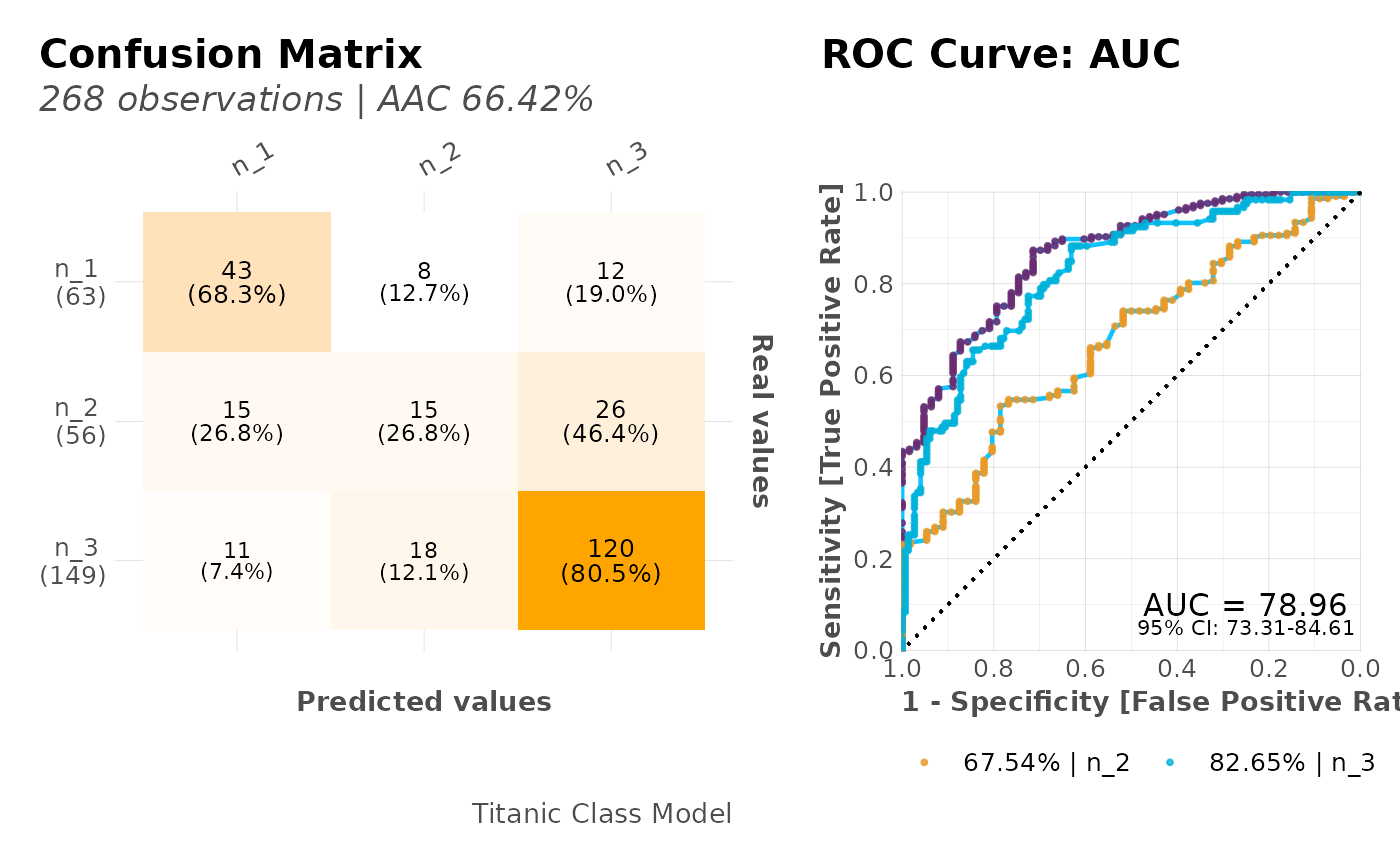
 # Dasboard for Multi-Categorical Model
mplot_full(dfr$class3$tag, dfr$class3$score,
multis = subset(dfr$class3, select = -c(tag, score)),
model_name = "Titanic Class Model"
)
# Dasboard for Multi-Categorical Model
mplot_full(dfr$class3$tag, dfr$class3$score,
multis = subset(dfr$class3, select = -c(tag, score)),
model_name = "Titanic Class Model"
)
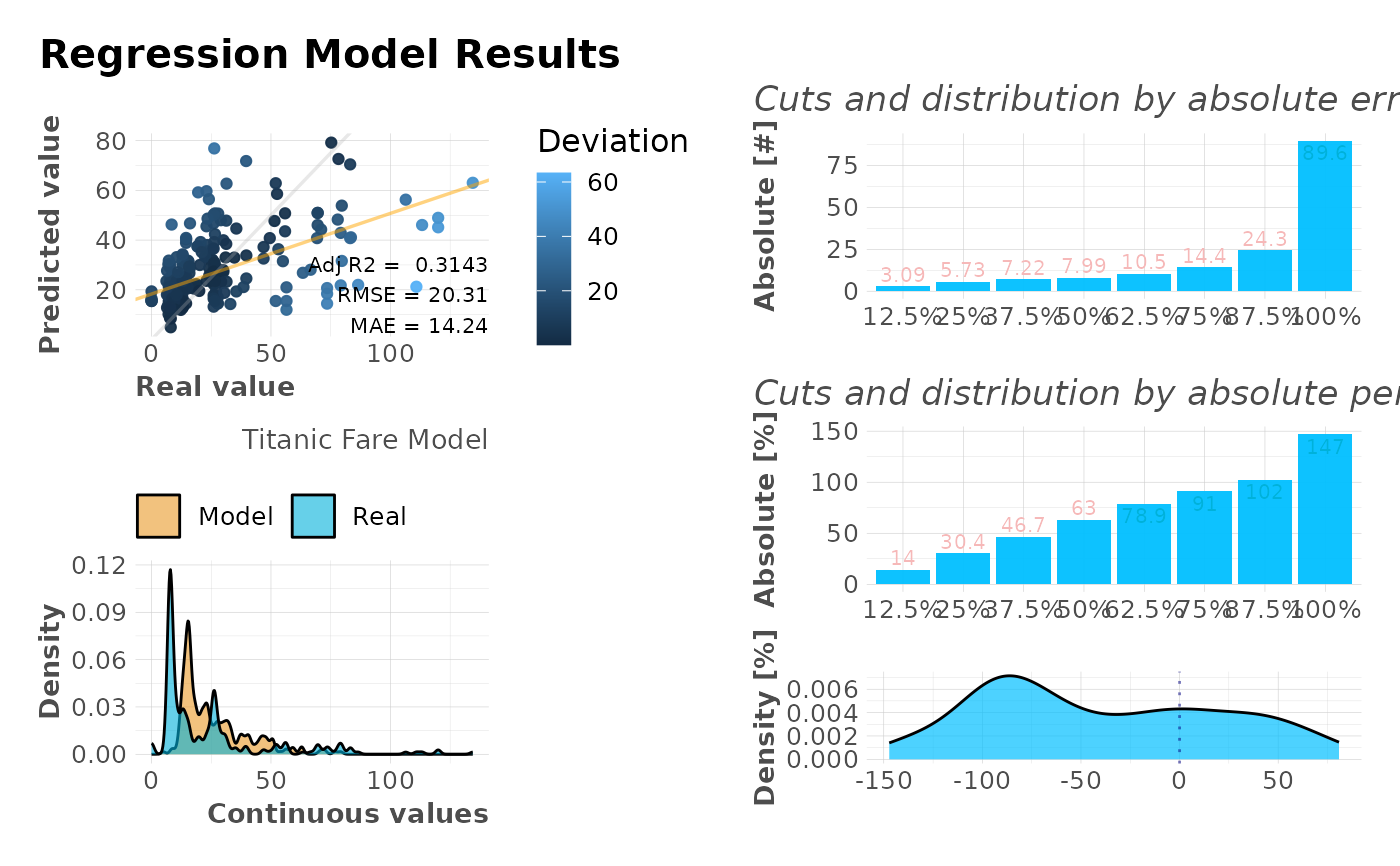
 # Dasboard for Regression Model
mplot_full(dfr$regr$tag, dfr$regr$score,
model_name = "Titanic Fare Model"
)
#> Warning: No shared levels found between `names(values)` of the manual scale and the
#> data's fill values.
#> Warning: No shared levels found between `names(values)` of the manual scale and the
#> data's fill values.
# Dasboard for Regression Model
mplot_full(dfr$regr$tag, dfr$regr$score,
model_name = "Titanic Fare Model"
)
#> Warning: No shared levels found between `names(values)` of the manual scale and the
#> data's fill values.
#> Warning: No shared levels found between `names(values)` of the manual scale and the
#> data's fill values.
 # }
# }