This function lets us split and compare quantiles on a given prediction to compare different categorical values vs scores grouped by equal sized buckets.
Usage
mplot_splits(
  tag,
  score,
  splits = 5,
  subtitle = NA,
  model_name = NA,
  save = FALSE,
  subdir = NA,
  file_name = "viz_splits.png"
)
Arguments
- tag
Vector. Real known label.
- score
Vector. Predicted value or model's result.
- splits
Integer. Number of separations to plot
- subtitle
Character. Subtitle to show in plot
- model_name
Character. Model's name
- save
Boolean. Save output plot into working directory
- subdir
Character. Sub directory on which you wish to save the plot
- file_name
Character. File name as you wish to save the plot
See also
Other ML Visualization:
mplot_conf(),
mplot_cuts(),
mplot_cuts_error(),
mplot_density(),
mplot_full(),
mplot_gain(),
mplot_importance(),
mplot_lineal(),
mplot_metrics(),
mplot_response(),
mplot_roc(),
mplot_topcats()
Examples
Sys.unsetenv("LARES_FONT") # Temporal
data(dfr) # Results for AutoML Predictions
lapply(dfr, head)
#> $class2
#> tag scores
#> 1 TRUE 0.3155498
#> 2 TRUE 0.8747599
#> 3 TRUE 0.8952823
#> 4 FALSE 0.0436517
#> 5 TRUE 0.2196593
#> 6 FALSE 0.2816101
#>
#> $class3
#> tag score n_1 n_2 n_3
#> 1 n_3 n_2 0.20343865 0.60825062 0.18831071
#> 2 n_2 n_3 0.17856154 0.07657769 0.74486071
#> 3 n_1 n_1 0.50516951 0.40168718 0.09314334
#> 4 n_3 n_2 0.30880713 0.39062151 0.30057135
#> 5 n_2 n_3 0.01956827 0.07069011 0.90974158
#> 6 n_2 n_3 0.07830017 0.15408720 0.76761264
#>
#> $regr
#> tag score
#> 1 11.1333 25.93200
#> 2 30.0708 39.91900
#> 3 26.5500 50.72246
#> 4 31.2750 47.81292
#> 5 13.0000 30.12853
#> 6 26.0000 13.24153
#>
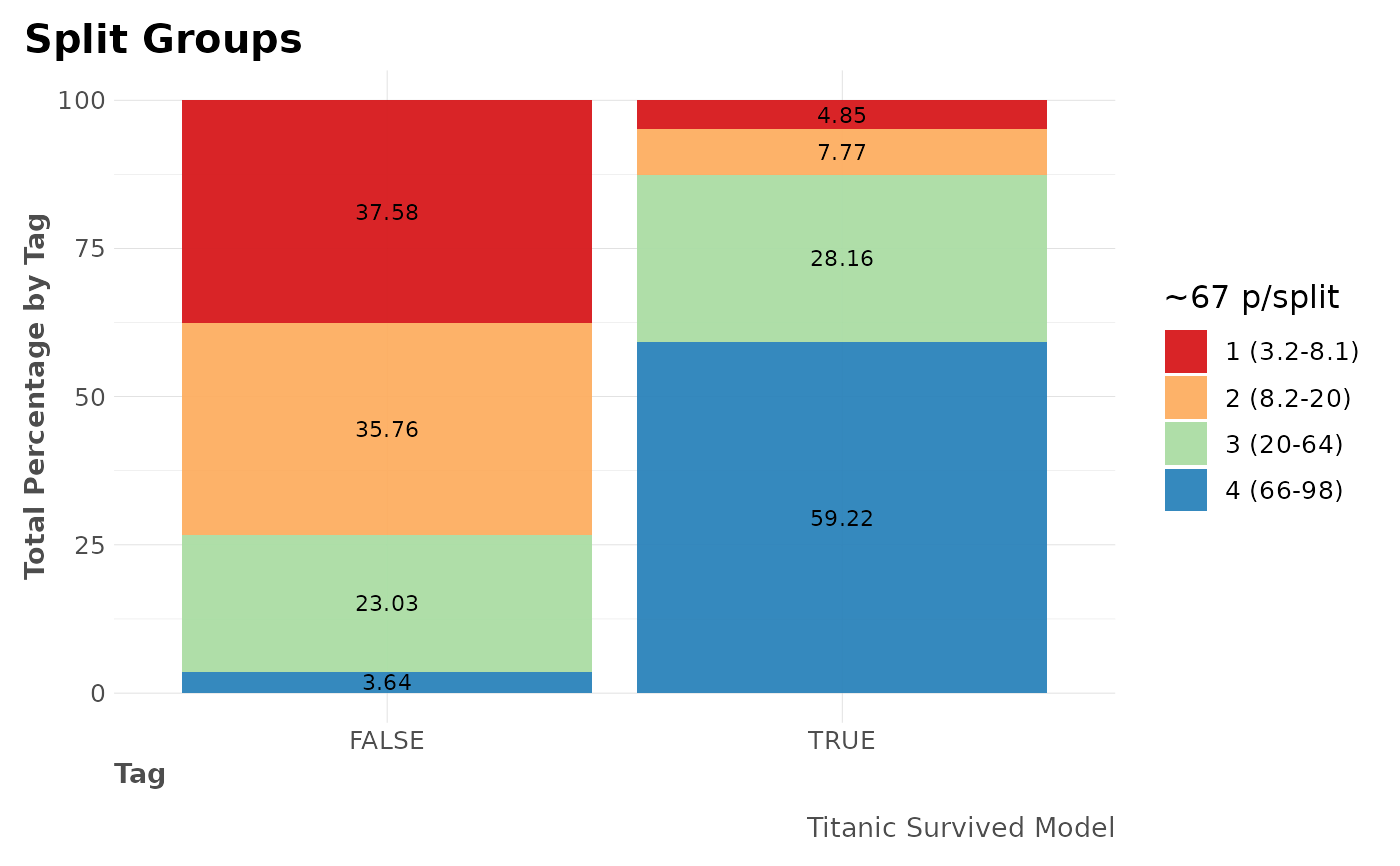
# For categorical (binary) values
mplot_splits(dfr$class2$tag, dfr$class2$scores,
splits = 4,
model_name = "Titanic Survived Model"
)
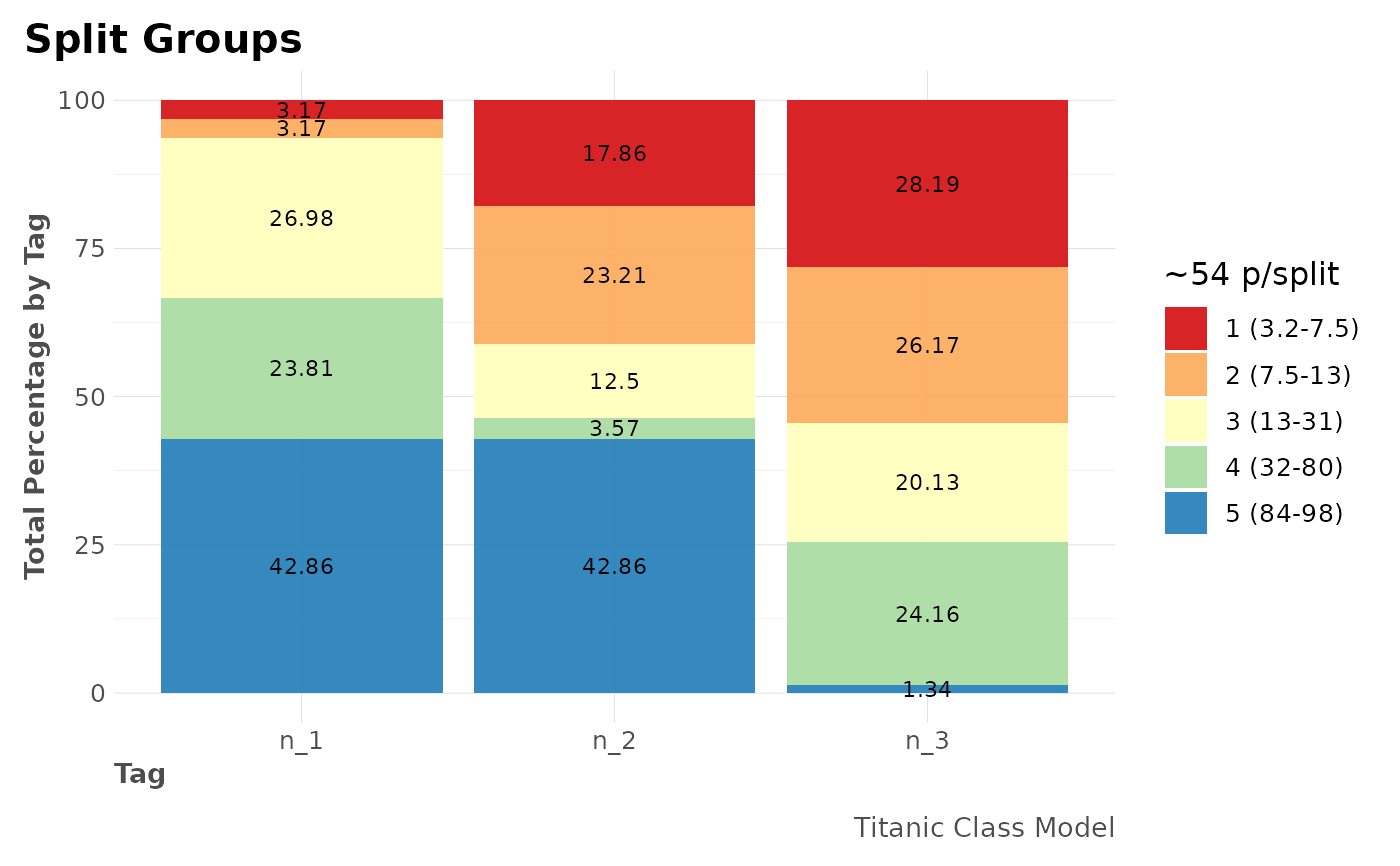
 # For categorical (+2) values
mplot_splits(dfr$class3$tag, dfr$class2$scores,
model_name = "Titanic Class Model"
)
# For categorical (+2) values
mplot_splits(dfr$class3$tag, dfr$class2$scores,
model_name = "Titanic Class Model"
)
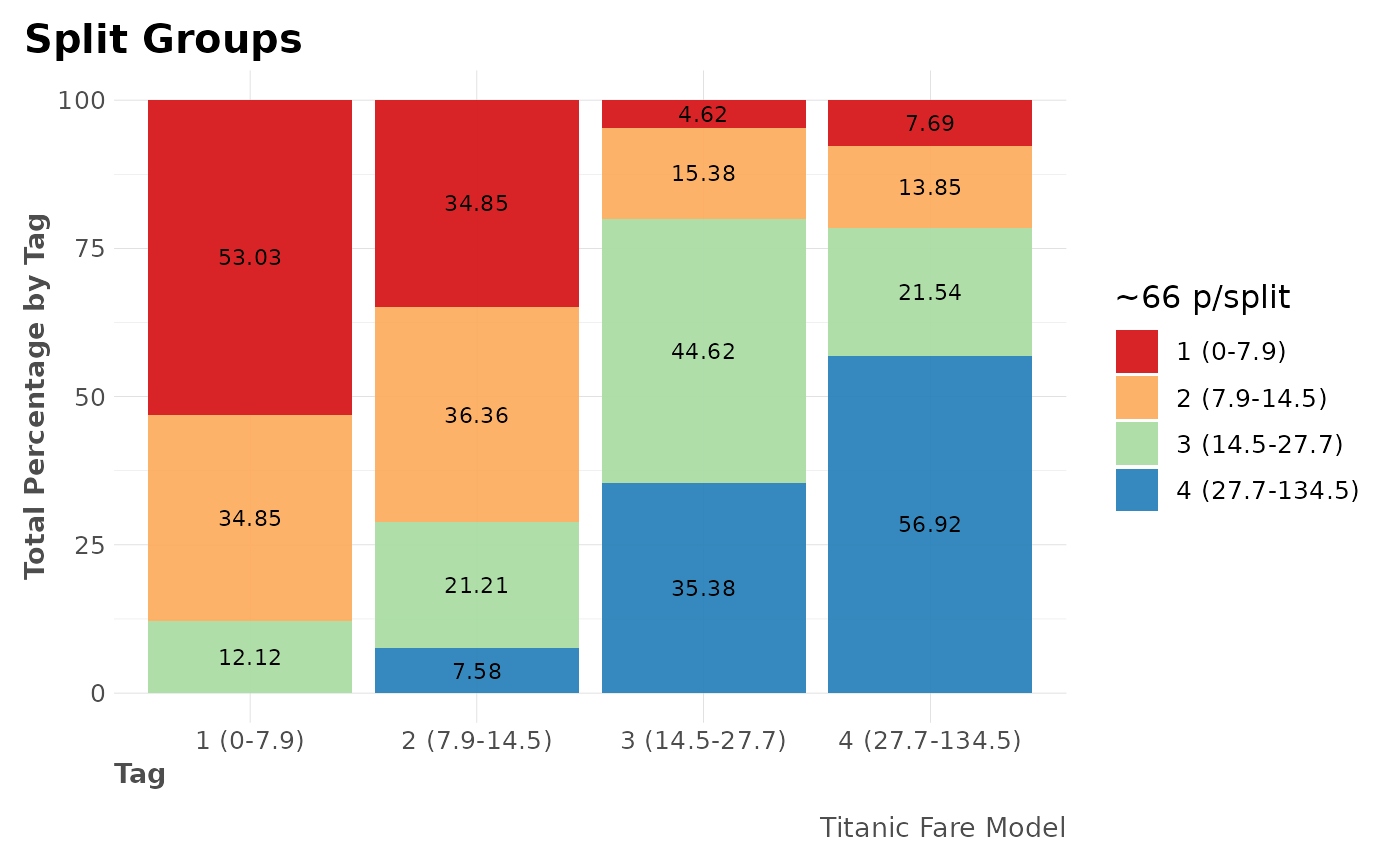
 # For continuous values
mplot_splits(dfr$regr$tag, dfr$regr$score,
splits = 4,
model_name = "Titanic Fare Model"
)
# For continuous values
mplot_splits(dfr$regr$tag, dfr$regr$score,
splits = 4,
model_name = "Titanic Fare Model"
)