This function cuts by quantiles any score or prediction.
Usage
mplot_cuts(
  score,
  splits = 10,
  model_name = NA,
  subtitle = NA,
  table = FALSE,
  save = FALSE,
  subdir = NA,
  file_name = "viz_ncuts.png"
)
Arguments
- score
Vector. Predicted value or model's result.
- splits
Integer. Numer of separations to plot
- model_name
Character. Model's name
- subtitle
Character. Subtitle to show in plot
- table
Boolean. Do you wish to return a table with results?
- save
Boolean. Save output plot into working directory
- subdir
Character. Sub directory on which you wish to save the plot
- file_name
Character. File name as you wish to save the plot
See also
Other ML Visualization:
mplot_conf(),
mplot_cuts_error(),
mplot_density(),
mplot_full(),
mplot_gain(),
mplot_importance(),
mplot_lineal(),
mplot_metrics(),
mplot_response(),
mplot_roc(),
mplot_splits(),
mplot_topcats()
Examples
Sys.unsetenv("LARES_FONT") # Temporal
data(dfr) # Results for AutoML Predictions
head(dfr$class2)
#> tag scores
#> 1 TRUE 0.3155498
#> 2 TRUE 0.8747599
#> 3 TRUE 0.8952823
#> 4 FALSE 0.0436517
#> 5 TRUE 0.2196593
#> 6 FALSE 0.2816101
# Data
mplot_cuts(dfr$class2$scores, splits = 5, table = TRUE)
#> range cuts
#> 1 20% 0.074886
#> 2 40% 0.132404
#> 3 60% 0.312343
#> 4 80% 0.799710
#> 5 100% 0.982415
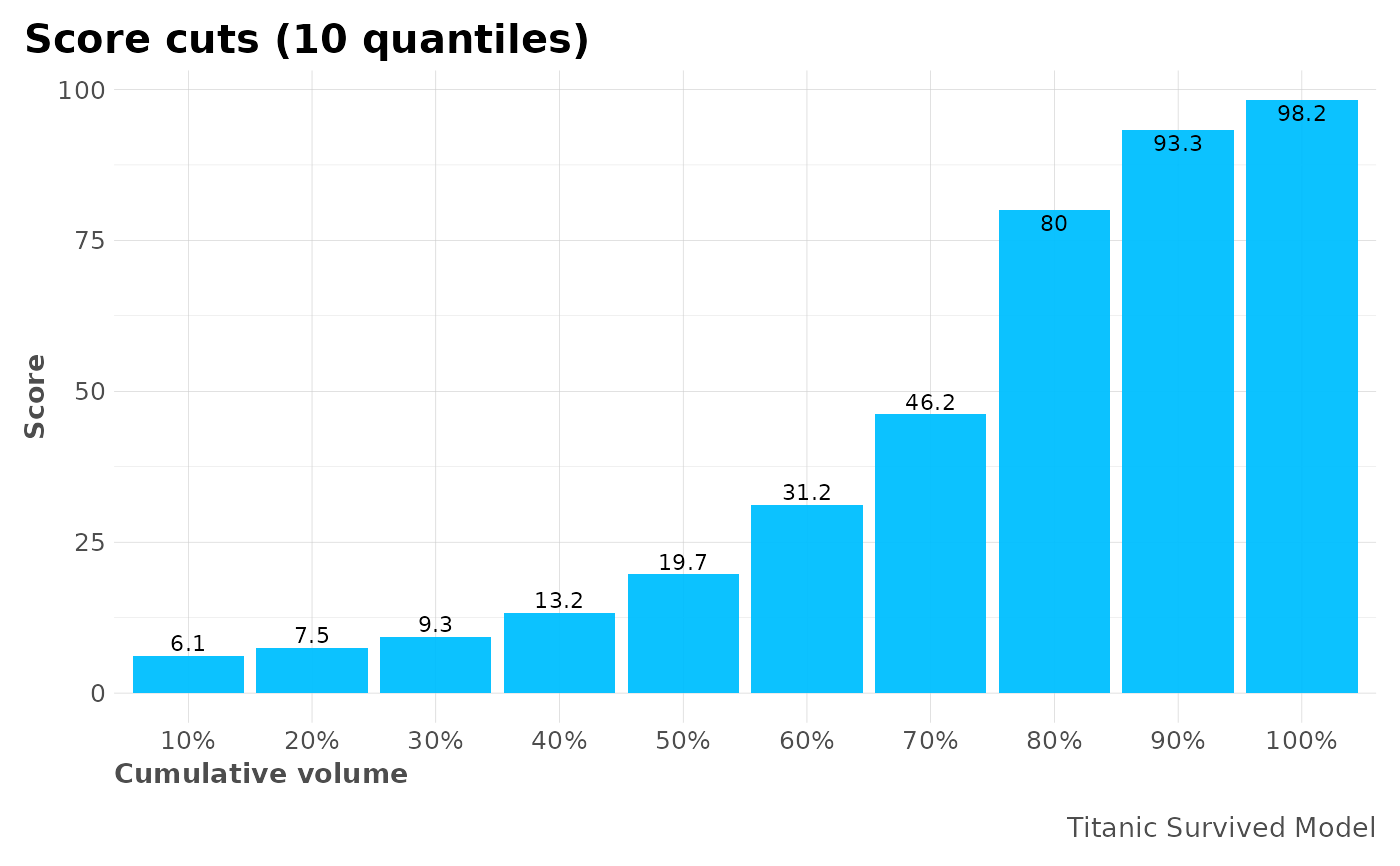
# Plot
mplot_cuts(dfr$class2$scores, model_name = "Titanic Survived Model")