Cuts by quantiles on absolute and percentual errors plot
Source:R/model_plots.R
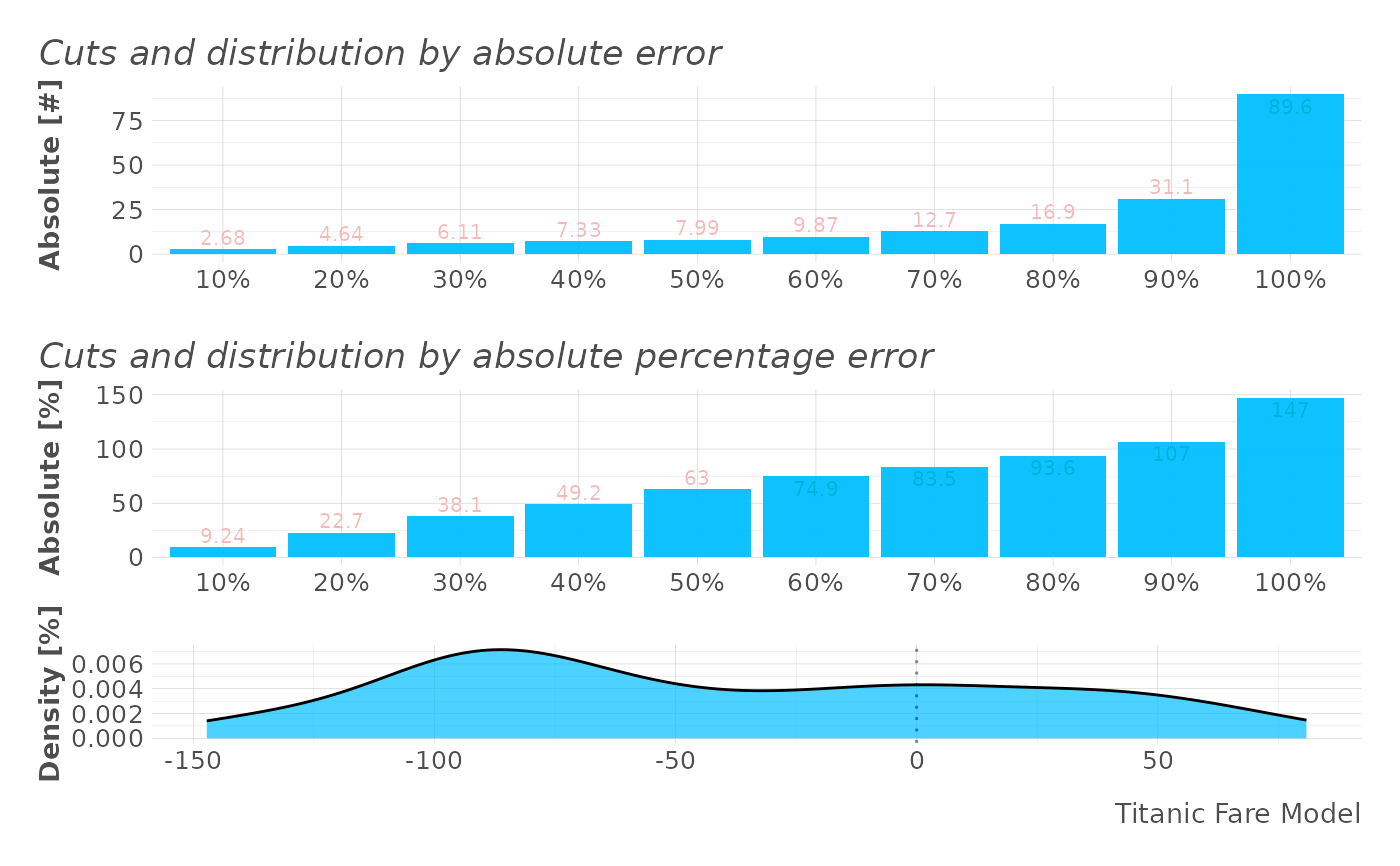
mplot_cuts_error.RdThis function cuts by quantiles on absolute and percentual errors
Usage
mplot_cuts_error(
  tag,
  score,
  splits = 10,
  title = NA,
  model_name = NA,
  save = FALSE,
  subdir = NA,
  file_name = "viz_ncuts_error.png"
)
Arguments
- tag
Vector. Real known label.
- score
Vector. Predicted value or model's result.
- splits
Integer. Number of separations to plot
- title
Character. Title to show in plot
- model_name
Character. Model's name
- save
Boolean. Save output plot into working directory
- subdir
Character. Sub directory on which you wish to save the plot
- file_name
Character. File name as you wish to save the plot
See also
Other ML Visualization:
mplot_conf(),
mplot_cuts(),
mplot_density(),
mplot_full(),
mplot_gain(),
mplot_importance(),
mplot_lineal(),
mplot_metrics(),
mplot_response(),
mplot_roc(),
mplot_splits(),
mplot_topcats()
Examples
Sys.unsetenv("LARES_FONT") # Temporal
data(dfr) # Results for AutoML Predictions
head(dfr$regr)
#>       tag    score
#> 1 11.1333 25.93200
#> 2 30.0708 39.91900
#> 3 26.5500 50.72246
#> 4 31.2750 47.81292
#> 5 13.0000 30.12853
#> 6 26.0000 13.24153
mplot_cuts_error(dfr$regr$tag, dfr$regr$score,
  model_name = "Titanic Fare Model"
)
#> Warning: No shared levels found between `names(values)` of the manual scale and the
#> data's fill values.
#> Warning: No shared levels found between `names(values)` of the manual scale and the
#> data's fill values.