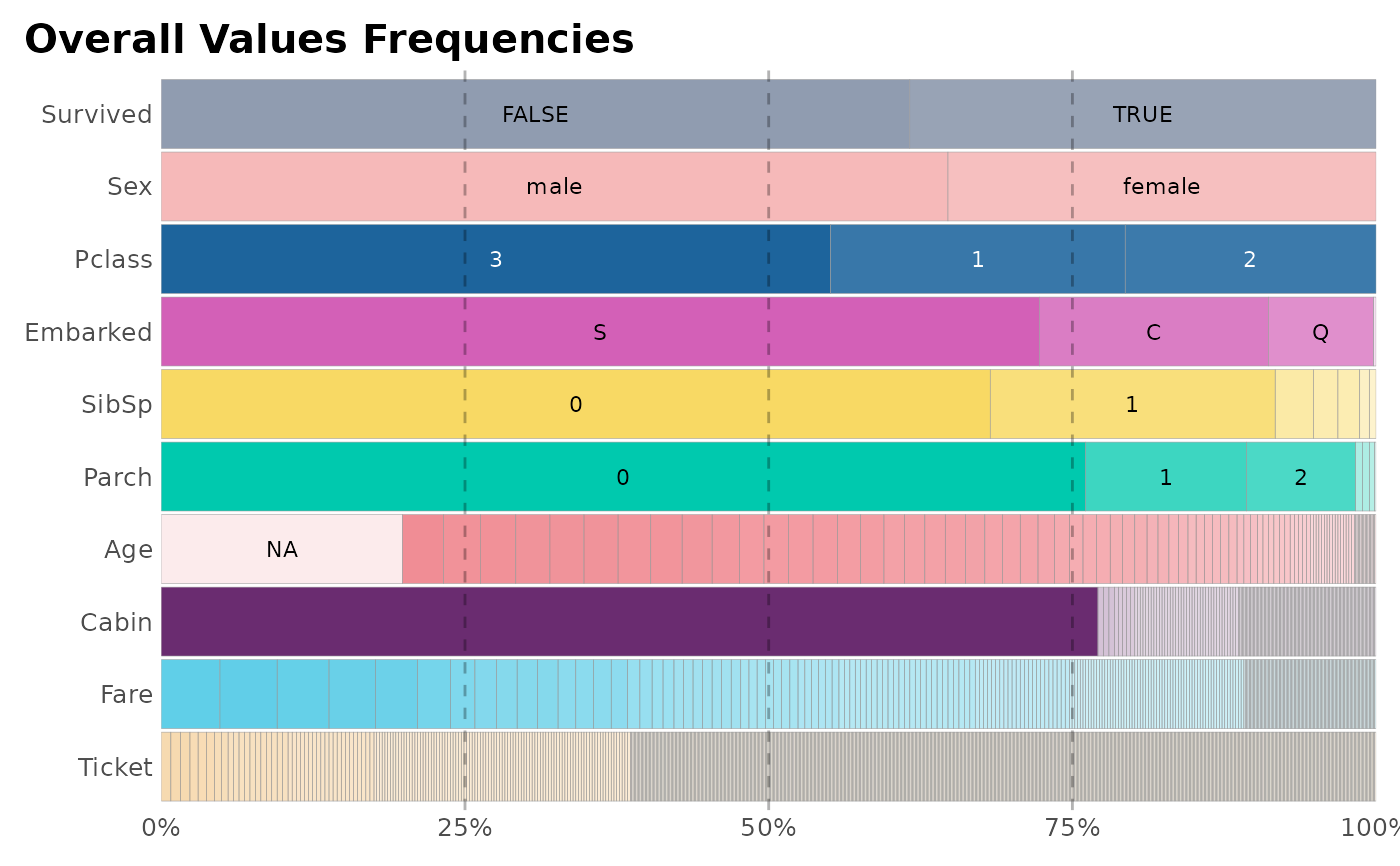
This function lets the user analize data by visualizing the frequency of each value of each column from a whole data frame.
Usage
freqs_df(
  df,
  max = 0.9,
  min = 0,
  novar = TRUE,
  plot = FALSE,
  top = 30,
  quiet = FALSE,
  save = FALSE,
  subdir = NA
)
Arguments
- df
Data.frame
- max
Numeric. Top variance threshold. Range: (0-1]. These variables will be excluded
- min
Numeric. Minimum variance threshold. Range: [0-1). These values will be grouped into a high frequency (HF) value
- novar
Boolean. Remove no variance columns?
- plot
Boolean. Do you want to see a plot? Three variables tops
- top
Integer. Plot most relevant (less categories) variables
- quiet
Boolean. Keep quiet? If not, informative messages will be shown.
- save
Boolean. Save the output plot in our working directory
- subdir
Character. Into which subdirectory do you wish to save the plot to?
See also
Other Frequency:
freqs(),
freqs_list(),
freqs_plot()
Other Exploratory:
corr_var(),
crosstab(),
df_str(),
distr(),
freqs(),
freqs_list(),
freqs_plot(),
lasso_vars(),
missingness(),
plot_cats(),
plot_df(),
plot_nums(),
tree_var()
Other Visualization:
distr(),
freqs(),
freqs_list(),
freqs_plot(),
noPlot(),
plot_chord(),
plot_survey(),
plot_timeline(),
tree_var()
Examples
data(dft) # Titanic dataset
freqs_df(dft)
#> 1 variables with more than 0.9 variance exluded: 'PassengerId'
#> # A tibble: 1,191 × 5
#> # Groups:   variable [10]
#>    variable value        n     p  pcum
#>    <chr>    <chr>    <int> <dbl> <dbl>
#>  1 Cabin    ""         687  77.1  77.1
#>  2 Parch    "0"        678  76.1  76.1
#>  3 Embarked "S"        644  72.3  72.3
#>  4 SibSp    "0"        608  68.2  68.2
#>  5 Sex      "male"     577  64.8  64.8
#>  6 Survived "FALSE"    549  61.6  61.6
#>  7 Pclass   "3"        491  55.1  55.1
#>  8 Survived "TRUE"     342  38.4 100
#>  9 Sex      "female"   314  35.2 100
#> 10 Pclass   "1"        216  24.2  79.3
#> # ℹ 1,181 more rows
freqs_df(dft, plot = TRUE)
#> 1 variables with more than 0.9 variance exluded: 'PassengerId'

