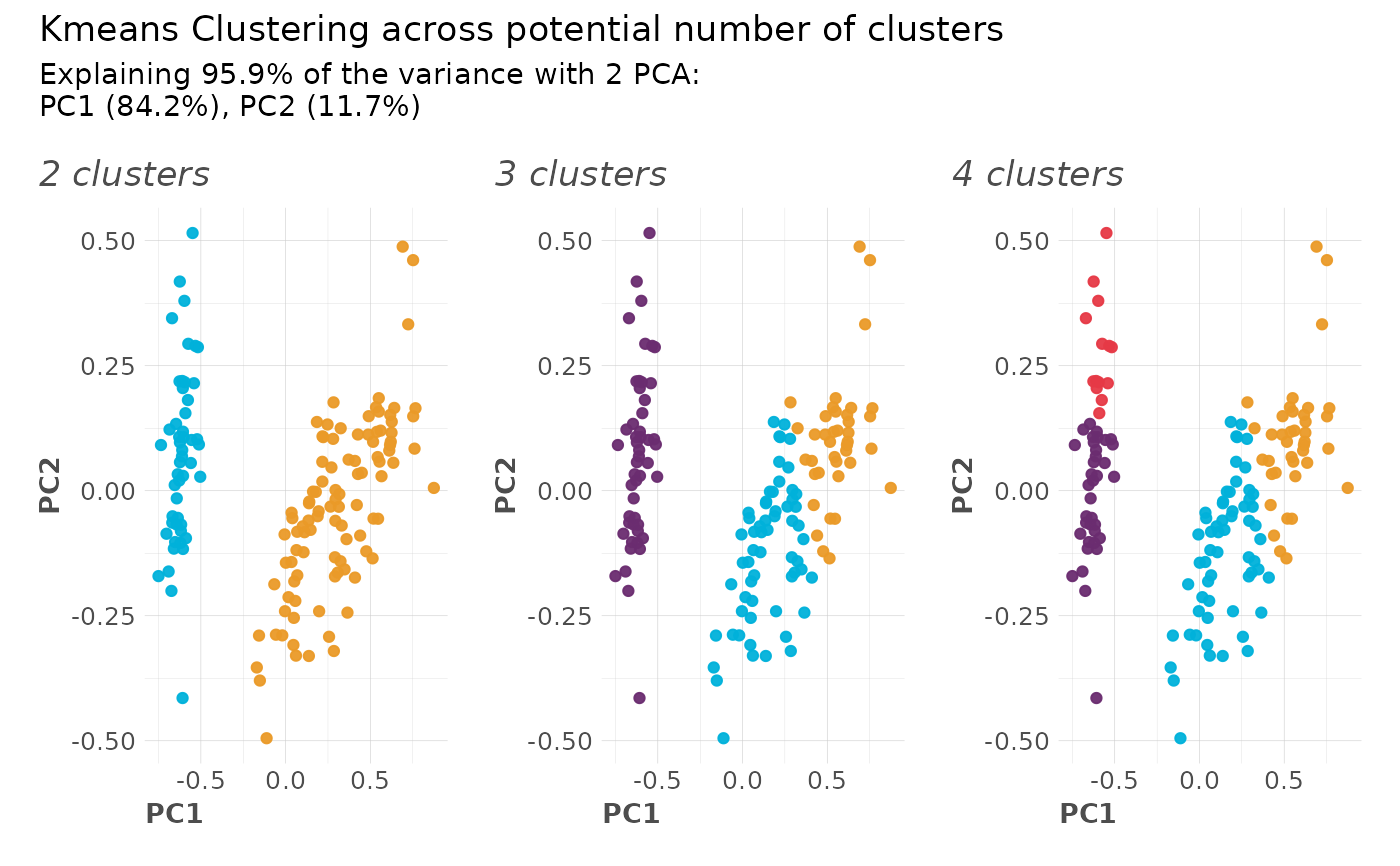
Visualize cluster data for assorted values of k.
See also
Other Clusters:
clusterKmeans(),
clusterOptimalK(),
reduce_pca(),
reduce_tsne()
Examples
Sys.unsetenv("LARES_FONT") # Temporal
data("iris")
df <- subset(iris, select = c(-Species))
df <- df[sample(nrow(df)), ]

# Calculate and plot
result <- clusterVisualK(df, ks = 2:4)
plot(result$plot)


# You can use the data generated as well
lapply(result$data, function(x) head(x$cluster, 10))
#> [[1]]
#>  [1] 2 2 1 2 1 1 1 1 1 1
#> Levels: 1 2
#>
#> [[2]]
#>  [1] 3 3 1 3 2 1 2 2 2 2
#> Levels: 1 2 3
#>
#> [[3]]
#>  [1] 3 3 1 3 2 1 2 2 2 2
#> Levels: 1 2 3 4
#>
# You can use the data generated as well
lapply(result$data, function(x) head(x$cluster, 10))
#> [[1]]
#> [1] 2 2 1 2 1 1 1 1 1 1
#> Levels: 1 2
#>
#> [[2]]
#> [1] 3 3 1 3 2 1 2 2 2 2
#> Levels: 1 2 3
#>
#> [[3]]
#> [1] 3 3 1 3 2 1 2 2 2 2
#> Levels: 1 2 3 4
#>